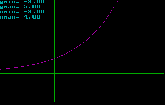
Draw a chart by value field
Delphi & Pascal (česká wiki)
Category: KMP (Club of young programmers)
 Author: Ľuboš Saloky
Program: Grafy4p.pas
File exe: Grafy4p.exe
need: Egavga.bgi
 Author: Ľuboš Saloky
Program: Grafy4p.pas
File exe: Grafy4p.exe
need: Egavga.bgi
Draw a chart by value field. With the graph can be moved using the keys a, s, w, z.
{ grafy4p.pas                                                       }
{ Kresli graf podla pola hodnoty.                                   }
{ Grafom je mozne hybat pomocou klaves a,s,w,z.                     }
{                                                                   }
{ Author: Ľuboš Saloky                                              }
{ Datum: 01.01.1996                           http://www.trsek.com  }

program grafmaster;
uses graph,crt,dos;
const HorizRes=320;
      VertRes=200;
var x,y,xmin,xmax,ymin,ymax,xrel,yrel:real;
    gd,gm,cyklus,osX,posun,z:integer;
    farba:byte;                           {farba grafu}
    rataj:integer;                        {pre procedury - vyzva vypocitat hodnoty[rataj]}
    hodnoty:array[0..HorizRes] of integer;{pole s hodnotami pre prikaz LineTo}
    s,d,f,g:string;
    ch:char;                              {pre ReadKey}
procedure Vypocitaj;           {vypocita funkcnu hodnotu pre zadanu horizontalnu suradnicu}
begin
{ ----- sem zadaj hladanu funkciu ----- }
  y:=Exp(x*ln(2)){abs(abs(x*x+2*x-2)-6)-2};
  hodnoty[rataj]:=round((VertRes*(ymax-y))/(ymax-ymin));
end;

procedure os;
var osY:integer;
begin
  if (xmin<0) and(xmax>0) then
  begin
    osY:=trunc(-xmin/xrel);
    line(osY,0,osY,VertRes-1);
  end;
end;
procedure Kresli;              {kresli graf podla pola hodnoty}
var store,hod:byte;
    pom1:longint;
begin
  store:=getcolor;
  if store=0 then setcolor(0)
             else setcolor(2);
  os;
  line(0,osX,HorizRes-1,osX);
  setcolor(store);
  MoveTo(0,hodnoty[0]);
  for cyklus:=1 to HorizRes-2 do
  begin
  pom1:=$b8000+longint(hodnoty[cyklus])*(HorizRes div 2)+cyklus div 2;
    if cyklus mod 2=1 then hod:=16
                      else hod:=1;
  putpixel(cyklus,hodnoty[cyklus],store);
{  lineto(cyklus,hodnoty[cyklus]);        }
  end;
  if store=0 then setcolor(0)
                  else setcolor(3);
  str(ymin:1:2,s);
  if store>0 then outtextxy(0,0,'ymin=');
  outtextxy(48,0,s);
  str(ymax:1:2,d);
  if store>0 then outtextxy(0,10,'ymax=');
  outtextxy(48,10,d);
  str(xmin:1:2,f);
  if store>0 then outtextxy(0,20,'xmin=');
  outtextxy(48,20,f);
  str(xmax:1:2,g);
  if store>0 then outtextxy(0,30,'xmax=');
  outtextxy(48,30,g);
end;
procedure PosuvajVpravo;        {posuva cely graf o 'posun' bodov dolava}
begin
  setcolor(0);
  Kresli;
  setcolor(farba);
  move(hodnoty[posun],hodnoty[0],HorizRes*2-2*posun);
  xmin:=xmin+xrel*posun;
  xmax:=xmax+xrel*posun;
  for z:=HorizRes-2-posun to HorizRes-2 do
  begin
    rataj:=z;
    x:=xmax-xrel*(HorizRes-z-2);
    Vypocitaj;
  end;
  Kresli;
end;
procedure PosuvajVlavo;       {posuva cely graf o 'posun' bodov doprava}
begin
  setcolor(0);
  Kresli;
  setcolor(farba);
  move(hodnoty[0],hodnoty[posun],HorizRes*2-2*posun);
  xmin:=xmin-xrel*posun;
  xmax:=xmax-xrel*posun;
  for z:=0 to posun do
    begin
    rataj:=z;
    x:=xmin+xrel*z;
    Vypocitaj;
    end;
  Kresli;
end;
procedure PosuvajHore;
begin
  setcolor(0);
  Kresli;
  setcolor(farba);
  for z:=0 to HorizRes-1 do
    Inc(hodnoty[z],posun);
  ymin:=ymin+yrel*posun;
  ymax:=ymax+yrel*posun;
  osX:=osX+posun;
  Kresli;
end;
procedure PosuvajDole;
begin
  setcolor(0);
  Kresli;
  Setcolor(farba);
  for z:=0 to HorizRes-1 do
    Dec(hodnoty[z],posun);
  ymin:=ymin-yrel*posun;
  ymax:=ymax-yrel*posun;
  osX:=osX-posun;
  Kresli;
end;
                                                  {hlavny program}
BEGIN
gd:=9;gm:=2;farba:=5;
initgraph(gd,gm,'');
xmin:=-2;xmax:=4;ymin:=-2;ymax:=5;x:=xmin;posun:=5;
xrel:=(xmax-xmin)/HorizRes;
yrel:=(ymax-ymin)/VertRes;
osX:=round(VertRes*ymax/(ymax-ymin));
os;
for rataj:=0 to Horizres-1 do
begin                                             {vypocita funkcne hodnoty}
  x:=x+xrel;
  Vypocitaj;
end;
setcolor(farba);
Kresli;
repeat
ch:=readkey;
if ch='a' then PosuvajVlavo;
if ch='s' then PosuvajVpravo;
if ch='w' then PosuvajHore;
if ch='z' then PosuvajDole;
until ch='c';
END.